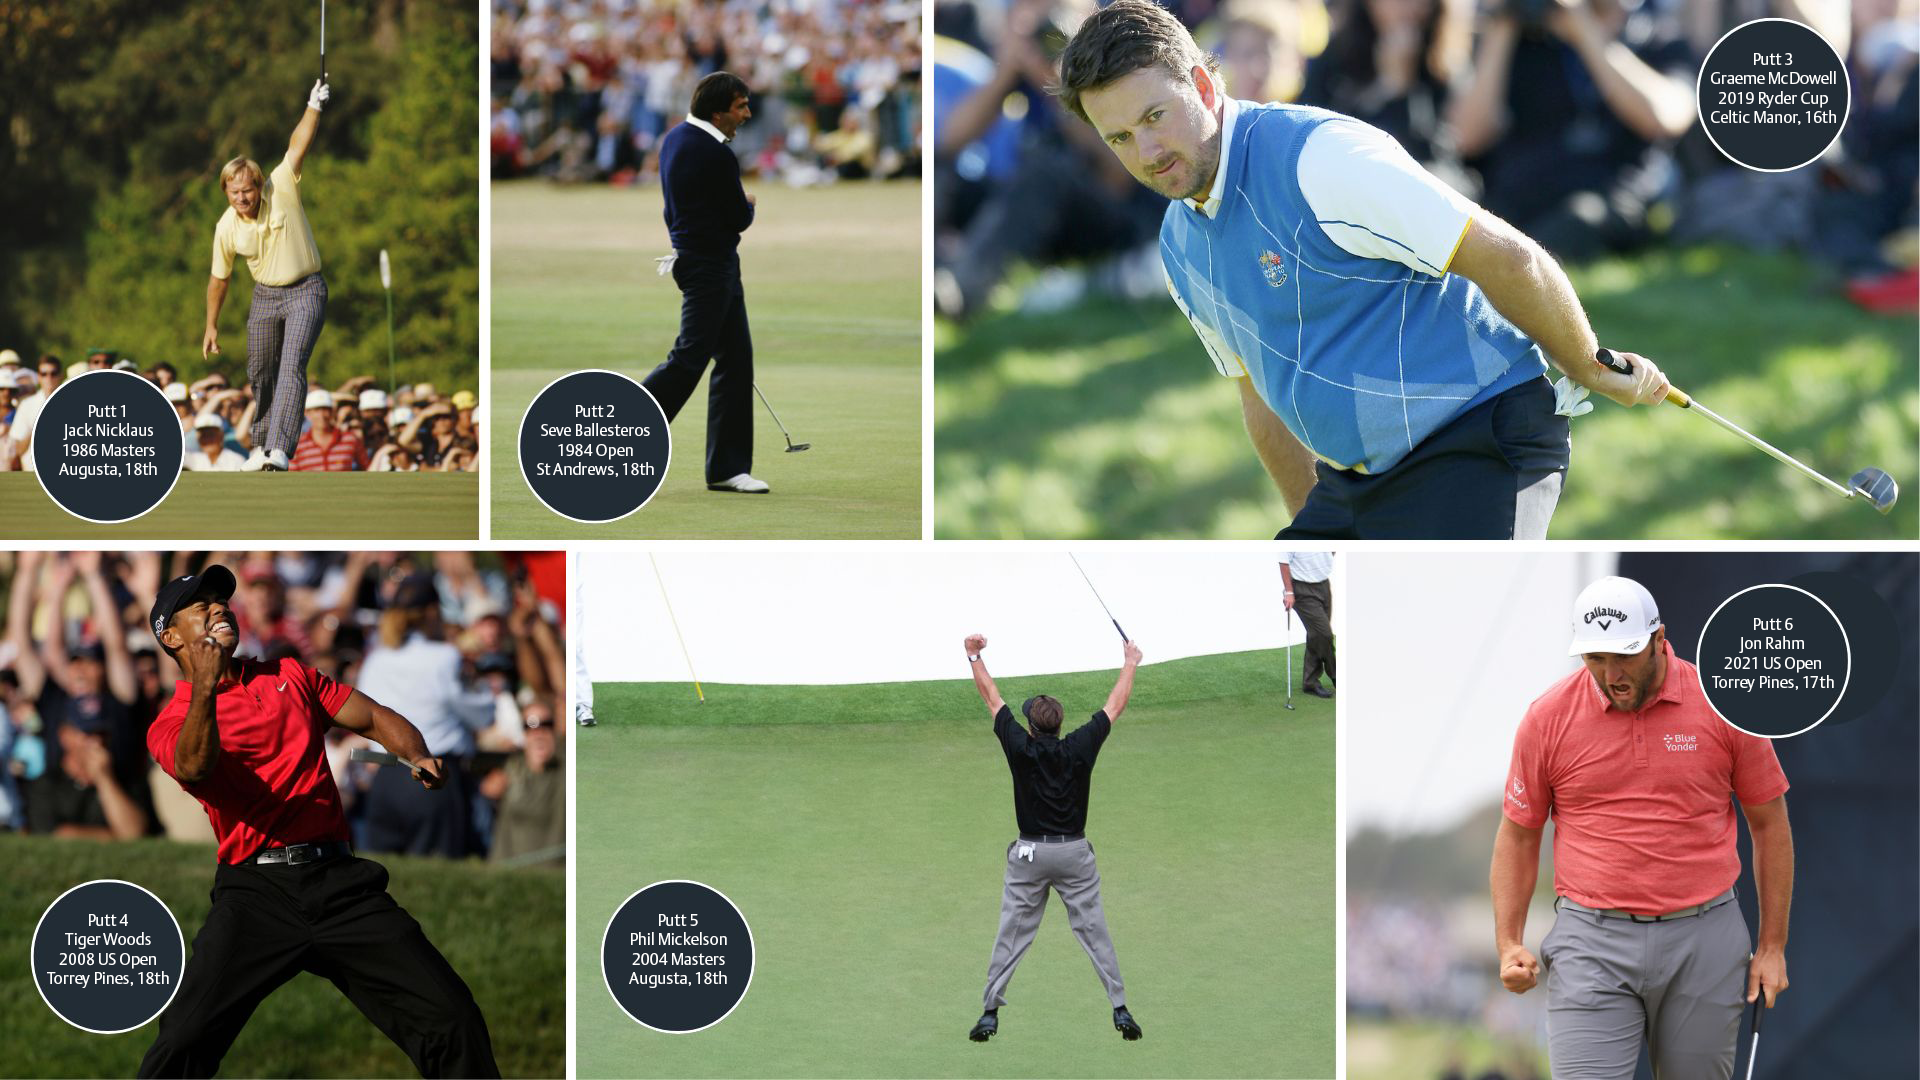
Dr Paul Hurrion, from Quintic Consultancy, uses six of the game's most famous successful putts - created by Zen Green Stage - to examine their distance, slope and conversion rate.
It is widely conceived that when putting, the closer the ball is to the hole, the higher the conversion rate. The proximity a ball finishes to the hole and strokes gained putting are two common statistics measured within both professional and amateur golf.
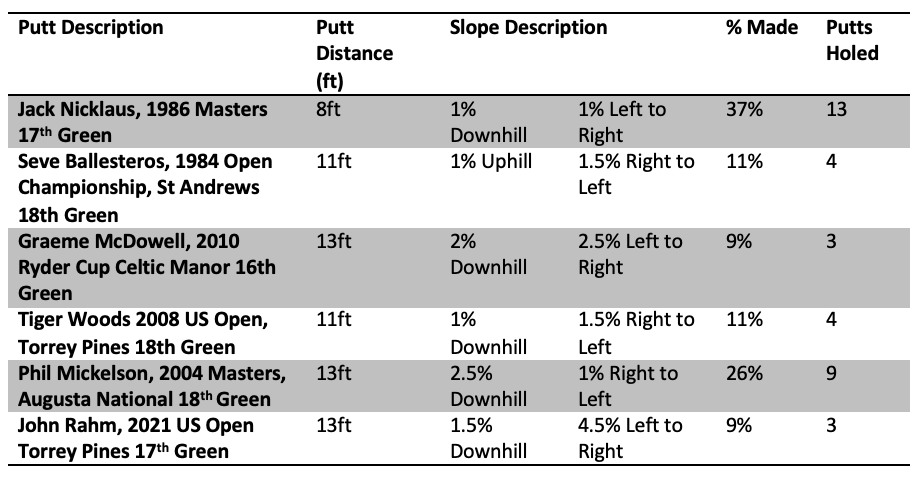
Strokes Gained Putting quantifies a golfer’s putting performance relative to the field, considering the initial distance of each putt, see Table 1. Therefore, holing a 10-foot putt scores higher than holing a six-foot putt. However, how many times do you hear a commentator say: “They have left themselves a tricky putt here” when faced with certain putts? Why do some putts feel easier than others, even though the putt may be longer?
I can find an eight-foot putt that most players of a single-figure handicap would be disappointed to miss, and yet I can find another eight-foot putt where the chance of even the best players in the world holing it is 10% at best.
Why is this? Proximity to hole is certainly a contributing factor for success rate. However, the following research study was designed to highlight that this is not the only consideration.
The six putts and the successful attempts at replicating them
The gradients for these six putts were originally created by the team at Zen Green Stage to celebrate the 150th Open Championship at St Andrews, for a ‘Famous Putts’ event.
Putt description and slope gradient of the Zen Green Stage
The straight-line distance for Putt 6 was 13ft 3ins with the Zen Green stage set to the following gradients: 1.5% downhill and 4.5% left to right. The average distance travelled for the putt was 14ft 5ins for the three holed putts (an 8.4% increase in the straight-line distance).
The lowest range in start direction was Putt 4, 9.23° (but only an 11% conversion rate). The largest range was Putt 6 28.98° (9% conversion rate)
Putts 2 and 4 were of 11 feet in length. Putt 4 has the lowest range in start direction range along with a higher average impact ball speed (both putts had an 11% conversion rate).
Putts 3, 5 and 6 were all of 13 feet in length. Putt 6 has the highest range in start direction and the highest average impact ball speed.
The author would like to acknowledge the contribution of Nick Middleton (Zen Golf founder & CEO) for his invaluable advice during this research project.
To view the full set of putting data, click here.
Methodology
The Quintic Overhead Putt Tracker system uses a high-resolution camera recording at 100 frames per second (fps) positioned above the playing surface. The overhead camera was placed in the centre of the Zen Green Stage. The dimension of the stage used for the study was 16ft x 8ft with the artificial surface stimping at 10.5 on the ‘Level’ setting.
The following parameters were recorded: impact ball speed; start direction; point of true roll; apex; separation point; entry speed; entry angle; total distance travelled; time to hole; sliding phase %; rolling phase %; and decay phase %.
The six different putts chosen for the study were replicas of famous putts in golfing history. The order of the six putts was randomised for each of the 35 subjects. Once the Zen Green stage had come to rest in the new putt gradients, video footage of the successful putt was played to the subject prior to performing that specific putt.
The data capture was “embedded” into a competitive game format whereby the participants were asked to compare their performance against historically significant putts. This further encouraged the players to exhibit more representative performance behaviours.
In addition, it also provided additional information regarding reading the putt, notably ball speed, slopes and direction the golf ball moved during the putt. The subject was then allowed a further 40 seconds to read and execute the putt. Each of the six putts was attempted by 35 golfers (handicap ranging from 24 to +3).
Implications for PGA Professionals
The putt with the highest % conversion rate was Putt 1 (8ft distance). This was the closest putt from all six putts recorded.
It is interesting to note that only two putts missed left (high) of the hole, the remaining 57% missed low.
Putt 1 was a very subtle 1% left to right and 1% downhill. Can the human feel the 1% slopes?
Fifteen attempts (43%) at Putt 2 were short – they never even made it past the hole. Again, asking the same question, can a human feel 1% slopes, this time uphill?
Putt 6, prior to the experimental testing, would have been deemed the hardest putt of all six.
With a 9% conversion rate, it could easily have been lower, given one person was extremely lucky to hole the putt with a ball entry speed of 2.2mph. At this entry speed, the effective cup size is significantly reduced, and if it had missed it was going to be a long way away!
This putt took only 2.69 seconds, whereas another holed putt for Putt 6, which had an entry speed of 0.8mph, took 5.25 seconds to reach the hole.
The longer the ball is in motion, the more time gravity has to act on the ball.
The putts that had the highest success rate also had the greatest range in impact ball speed
Putt 1 (37% success rate) had an impact ball speed range of 1.29 mph for the 13 successful putts.
Putt 5 (26% success rate) had an impact ball speed range of 1.96 mph for the nine successful putts.
The remaining four putts had a success rate lower than 11%. The lowest ranges for the ball speed for successful putts was 0.27 mph for Putt 2.
With such a small range in ball speed for success, this requires the golfers to ensure a very consistent touch with clubhead speed, acceleration and ball impact location.
How people practise ball impact speed and pace control is an area of continual investigation. Please remember, you can’t choose your start line until you know what speed the ball is going to enter the hole!